Your Strategy Lifecycle
Follows the timing, structures and actions that your company actually selected, producing a modelled assessment of the financial effect of that sequence of structural decisions.

A platform for analysing corporate debt and comparing refinancing decisions over time. For debt advisers and treasury teams: assess timing, fixed and floating rates, maturities and repayment structures, then review the assumptions and results in a complete PDF report.
Review complete example reports without an account. Guided access is available for working with the platform.
Debt decisions have a history and future consequences. Corporate Debt Lab turns complex debt decisions into a comparable, explainable and traceable process, providing recommendations on refinancing and debt structure. It starts with the contractual characteristics of the portfolio, connects them with governed market information, and compares eligible choices concerning timing, tenor, interest-rate structure and repayment profile.
The result is more than a recommendation: alternatives, the conditional financial effect of the structural choice, sensitivities, data provenance and an immutable evidence record that can be followed throughout the debt lifecycle.
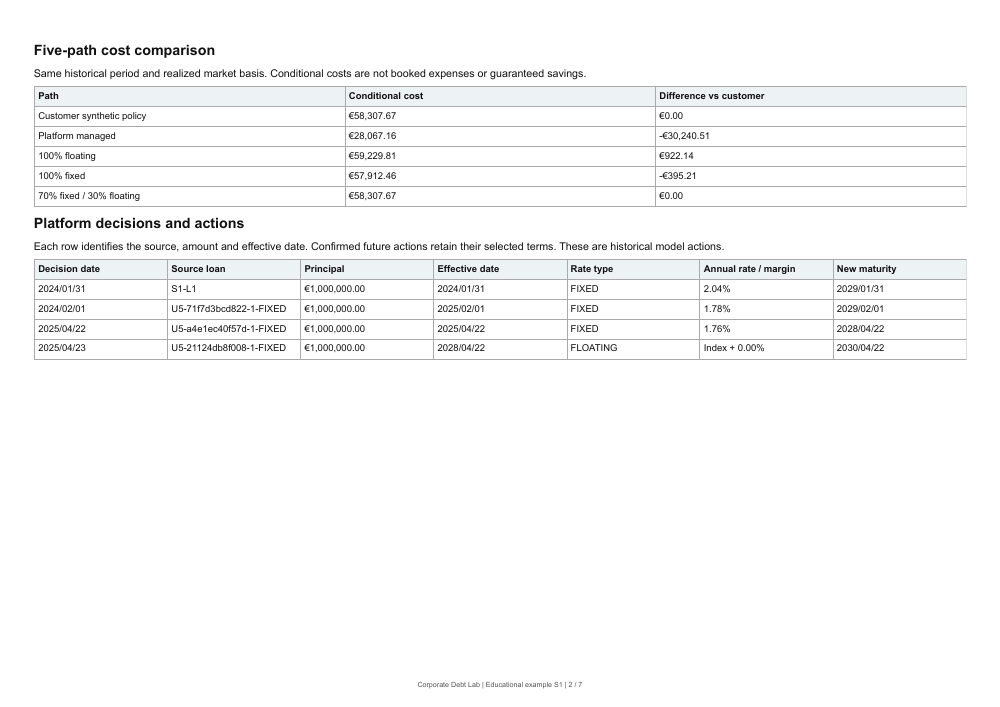
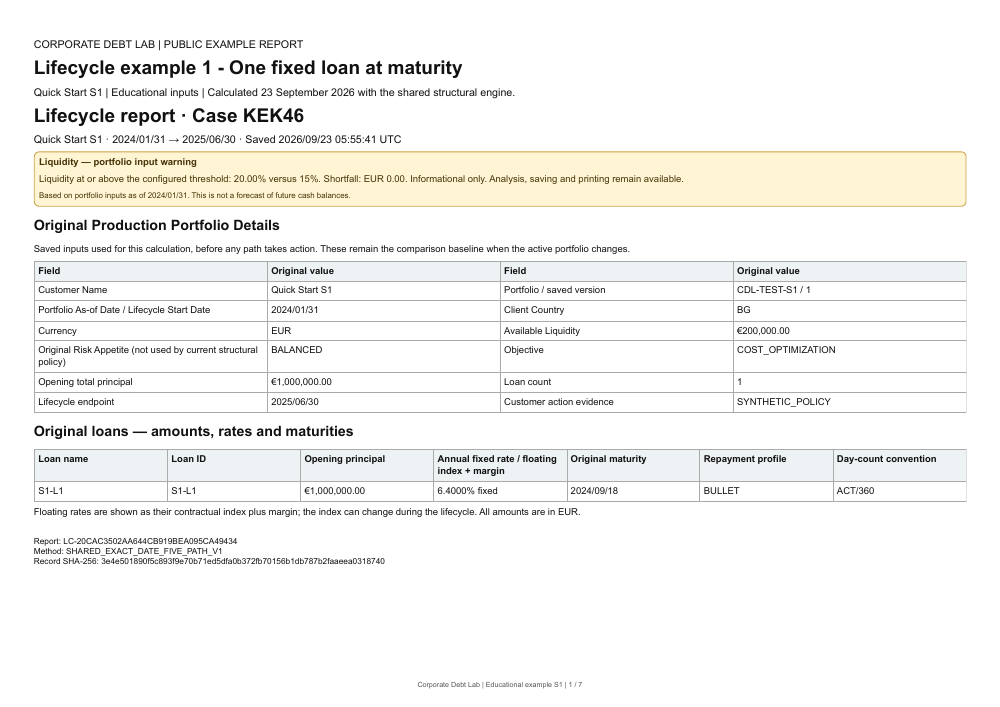
Start with a fixed-rate loan reaching maturity. Compare five modelled strategies, their refinancing decisions and the resulting debt terms.
Lifecycle 1 · 7 pages · Original inputs, comparison tables and decision history. No registration required.
Open the 7-page example →Start with a completed financing you know. Enter its initial debt terms and the decisions made along the way. Compare that history with the platform’s modelled alternatives, using information available at each historical decision date.
Follows the timing, structures and actions that your company actually selected, producing a modelled assessment of the financial effect of that sequence of structural decisions.
Shows how the same debt would have evolved if the platform’s eligible decisions had been used on its own eligible decision dates, based only on the information available at the time.
The modelled financial effect of the sequence of structural decisions you entered.
The modelled result of the parallel IR Managed lifecycle — the decisions the platform would have proposed at each historical decision point.
Your initial debt state, actual decisions, platform proposals, contractual executions and subsequent debt states in one chronology.
Compare the same case with transparent reference strategies.
Inputs, historical market observations, decisions, results and provenance remain available for reconstruction and verification without newer information altering the history.
The quality of a financing strategy is not demonstrated by one recommendation, but by its behaviour across a sequence of decisions and market conditions.
You can repeat the analysis with more than one completed case. You therefore do not have to accept the platform’s value on trust — you can test it against your own history. Once the method has proved useful on cases you already know, you can apply it to current debt decisions through LIVE DECISION.
See the final analysis produced from the Quick Start examples: original inputs, recommendations, comparisons and detailed debt changes. Every report is a complete, printable PDF. No account is required.
Educational cases, calculated on 23 September 2026. Lifecycle reports cover 31 January 2024 to 30 June 2025. LIVE reports use a decision date of 23 September 2026 and the stored ECB observation of 21 September 2026. Academy uses its own synthetic educational market context. These PDFs preserve their calculation basis.
| Quick Start example | What the full report includes | Read and print | |
|---|---|---|---|
| Lifecycle 1 - One fixed loan at maturity | Original debt, five paths, dated refinancing and before/after terms. | 7 pages 79 KB | Open PDF Download / print |
| Lifecycle 2 - One floating loan refinanced early | Floating-rate inputs and the effect of early refinancing. | 7 pages 78 KB | Open PDF Download / print |
| Lifecycle 3 - Three loans with staggered maturities | Portfolio inputs and changes across all three loans. | 9 pages 87 KB | Open PDF Download / print |
| Lifecycle 4 - Partial refinancing in two steps | Principal allocation and terms before and after each step. | 7 pages 79 KB | Open PDF Download / print |
| Lifecycle 5 - Two early decisions in a portfolio | Portfolio actions and the financial effect of each full path. | 9 pages 87 KB | Open PDF Download / print |
| Lifecycle 6 - A USD lifecycle | USD inputs, market basis and all five historical paths. | 7 pages 79 KB | Open PDF Download / print |
| LIVE - One source | Original inputs, recommendation, reference policies and sensitivity. | 3 pages 7 KB | Open PDF Download / print |
| LIVE - Review several sources | Three separate source reports for LIVE-A, LIVE-B and LIVE-C. | 9 pages 20 KB | Open PDF Download / print |
| Track a LIVE decision | Original position, confirmation and updated debt with reference costs. | 2 pages 5 KB | Open PDF Download / print |
| Training Academy - A committed attempt | Case facts, trainee choice, platform comparison and learning tables. | 3 pages 7 KB | Open PDF Download / print |
For paper review: open the PDF and select Print, A4 landscape, Fit to printable area. LIVE-L3 contains three separate source analyses; their savings are not added together. The Academy report is one illustrative attempt, since the guide lets each trainee choose independently.
Every financing decision changes the decisions that follow. Tenor determines when the company must return to the market. Fixed or floating interest changes how cost reacts to the rate environment. The timing and size of refinancing alter liquidity, maturity concentration and the capacity to act later.
Years later, that sequence is usually scattered across contracts, spreadsheets, presentations and personal memory. Corporate Debt Lab brings it together as a governed and reproducible history.
Current Debt Position → current recommendation → review and confirm → updated Current Debt Position. Follow the platform’s decisions and compare conditional costs as the debt evolves, with each saved decision available to reopen.
Save your initial LIVE analysis and open Track lifecycle. Review the debt amounts, interest terms and maturities, together with the platform’s current conditional cost and the 100% fixed, 100% floating and 70/30 reference costs.
Request a new recommendation using Current Debt Position and the available governed market information for today. The platform compares eligible refinancing dates, amounts, tenors and fixed or floating structures.
See which debt is affected, when each action takes effect, its new interest terms and maturity, and the conditional cost after confirmation. Compare it with the current position and reference paths on the same basis.
Confirm the recommendation to save it and apply its terms in the model as if executed on the recommended dates. Current Debt Position and conditional costs update automatically; future actions remain scheduled until their effective dates.
Return to the saved case at any time, review its latest model position and request another recommendation. The original inputs, original LIVE decision and subsequent confirmed decisions remain available for comparison.
Find the case directly in Saved LIVE Decisions. Open Track lifecycle, export JSON, CSV or a readable report, and print or save as PDF to review the position and its decisions outside the platform.
Currency, principal, maturity, interest-rate structure, coupon or reference index and margin, repayment profile and successor relationships.
Portfolio state, selected objective, transaction size and type, and supplied decision terms. Available liquidity provides an informational warning; it does not restrict structural recommendations.
Governed European Central Bank information, including the AAA euro-area central-government Svensson zero/spot curve and applicable tenor nodes.
Governed US observations and currency-specific rules, including SOFR after its introduction and DFF for the earlier regime, with no future information carried backwards.
Conditional Cost compares the effect of structural decisions; it is not the full contractual or accounting cost of debt. Fees, credit spread, bid-offer differences and other components may be excluded from this comparison only under the assumption that they are identical or approximately equal across the compared strategies. Material differences require separate business assessment and must not be treated as already included in the result.
Lower conditional cost than all three comparators simultaneously. Common 36-month horizon.
984 of 1000 cases.
959 of 1000 cases.
940 of 1000 cases.
The test asks whether the structural cost advantage persists when new financing is more expensive. The same constant spread is added to new financing and rollovers for the platform and every comparator. Existing contract terms and the starting market curve remain unchanged. Each scenario is optimized separately.
A 4% base funding rate becomes 5% with a 1 percentage-point spread, 7% with 3 points, and 9% with 5 points. This is not a simulation of market rates rising later during the tenor. That requires a dated market shock, floating-rate resets and refinancing events; existing fixed coupons stay fixed until refinancing or maturity.
The results provide strong evidence of CFSE’s ability to identify opportunities for lower debt costs and support its potential to improve the quality of financial decisions. They do not guarantee savings in every individual case, but demonstrate a consistent advantage over the comparator strategies in the controlled validation.
The same 1,000 diverse EUR cases, exact calendar dates and the shared engine. All 4,000 decisions were saved and reopened without error. The study compares conditional interest costs; fees are excluded.
| bps | ECP-A | ECP-B | ECP-C | All three |
|---|---|---|---|---|
| 0 | 990/1000 — 99.0% | 992/1000 — 99.2% | 994/1000 — 99.4% | 984/1000 — 98.4% |
| 100 | 972/1000 — 97.2% | 979/1000 — 97.9% | 987/1000 — 98.7% | 959/1000 — 95.9% |
| 300 | 945/1000 — 94.5% | 958/1000 — 95.8% | 995/1000 — 99.5% | 940/1000 — 94.0% |
| 500 | 925/1000 — 92.5% | 943/1000 — 94.3% | 998/1000 — 99.8% | 923/1000 — 92.3% |
Work through a specific situation as of a defined historical date. Commit to timing, tenor, interest-rate structure and repayment profile before seeing the reference result. Then compare the decision, its Decision Cost Gap and the principal structural differences.
Practice — Single Decision mode, with point-in-time information discipline.
Sufficient data, clear alternatives, a committed decision before the answer, and an understanding of consequences.
Designed for CFOs, Finance Directors, Group Treasurers, Treasury Managers and teams responsible for financing, liquidity, risk and planning. For advisory firms, it allows a recommendation to be followed beyond the presentation — through the client decision, contractual execution and the subsequent portfolio structure.
Start with 14 days free after email verification and organization setup. Extend once for another 14 days. No card required. After the trial, accept the monthly terms and securely save your card to activate paid access. No subscription payment is collected at card setup.
One named user. LIVE DECISION, LIFECYCLE, Training Academy, saved cases and printable reports.
Three named users in one organization. The same analytical capabilities and reports. Additional named users: €200 per user per month.
Monthly fees are collected after the calendar service month ends, after approved compensation is deducted. The first partial month is prorated by calendar day. Applicable taxes are shown on the invoice. Professional includes one named user; Team includes three, with additional seats at €200 per month each. Cancellation and changes to the number of seats take effect from the next calendar month. Each colleague uses their own verified account.
Start free trialRegister and verify your email to start 14 days of free access. You can extend once for another 14 days. No payment card is required for the trial.
Sign in to your Corporate Debt Lab workspace.
Verify your email and complete organization setup to start your 14-day free trial. One further 14-day extension is available. No card required.
Use the configured secure verification channel.
Reset instructions expire after one hour.
Confirm registered details and configure Corporate Debt Lab access.
Only products enabled by your active subscription are shown.