Debt Management · DM-3
Fixed vs Floating Corporate Debt: What Does Interest-Budget Protection Cost?
DM-3 | Debt Management · Practical Case Studies
A manufacturing company has €3 million of debt with three years remaining. Interest is paid quarterly, and the full principal falls due at maturity. Its finance director sets a planning limit: annual interest should remain below €135,000 even in an adverse interest-rate scenario.
To inform its financing policy, the team compares four hypothetical portfolios: entirely floating-rate debt, 50% fixed, 70% fixed and entirely fixed-rate debt. In each portfolio, any fixed-rate portion has already been contracted at 4%; floating-rate debt carries a modelled reference rate plus one percentage point. We test how those structures behave after the terms have been agreed. We do not assume the company can obtain a new 4% fixed loan after rates rise.
How much extra base-case interest is worth paying to limit the risk of exceeding the budget?
| Common input | Assumption |
|---|---|
| Debt and comparison horizon | €3,000,000; 36 months |
| Principal repayment | Bullet: €3 million due in month 36 |
| Interest and floating-rate resets | Quarterly; the next floating period starts now |
| Contracted fixed coupon | 4.00% |
| Floating-rate contractual margin | 1.00 percentage point |
| Base curve | Flat 2.50% continuously compounded zero rates |
| Management planning limit | €135,000 of annual interest |
All inputs are illustrative. They are not current bank quotations or forecasts. The €135,000 limit is a management assumption for this case, not a bank covenant or a threshold automatically determined by DM.
1. Base case: the visible cost of fixing the rate
The curve implies a floating rate, including the margin, of approximately 3.5078% per year. That is below the contracted 4% fixed coupon. More fixed-rate debt therefore increases interest expense in the base case.
| Fixed / floating share | Fixed / floating principal | Annual interest | 36-month interest |
|---|---|---|---|
| 0% / 100% | €0 / €3,000,000 | €105,235 | €315,705 |
| 50% / 50% | €1,500,000 / €1,500,000 | €112,617 | €337,852 |
| 70% / 30% | €2,100,000 / €900,000 | €115,570 | €346,711 |
| 100% / 0% | €3,000,000 / €0 | €120,000 | €360,000 |
The entirely floating portfolio is cheapest at about €105,235 a year. A 70% fixed / 30% floating structure costs €115,570. The difference is €10,336 a year, or €31,007 over three years: the additional modelled interest cost of reducing exposure to a rate increase.
Moving from 70% to 100% fixed adds another €4,430 a year in the base case. In return, the interest expense becomes independent of the two curve shocks examined here.
What the figures measure
DM applies the contracted coupon to existing fixed-rate principal. For the floating portion, the engine derives quarterly forward rates from the zero curve and adds the contractual margin. The measure is undiscounted conditional interest over a common horizon, not present value or total debt service.
Annual interest is identical in each of the three years because the curve is flat, the principal does not amortise and the accrual periods are equal. With a non-flat curve, annual results can differ. The €3 million principal remains due at maturity in every portfolio; comparing interest does not establish that the company can repay or refinance it.
2. What if the curve rises by two percentage points?
Raise every zero-curve node from 2.50% to 4.50%. Keep the contracted fixed coupon at 4% and the floating margin at one percentage point. The resulting floating rate is approximately 5.5254%. The shocked curve applies from the next period throughout the horizon.
| Fixed / floating | Annual interest | Increase from base | Against €135,000 limit |
|---|---|---|---|
| 0% / 100% | €165,762 | €60,527 | Above by €30,762 |
| 50% / 50% | €142,881 | €30,264 | Above by €7,881 |
| 70% / 30% | €133,729 | €18,158 | Below by €1,271 |
| 100% / 0% | €120,000 | €0 | Below by €15,000 |
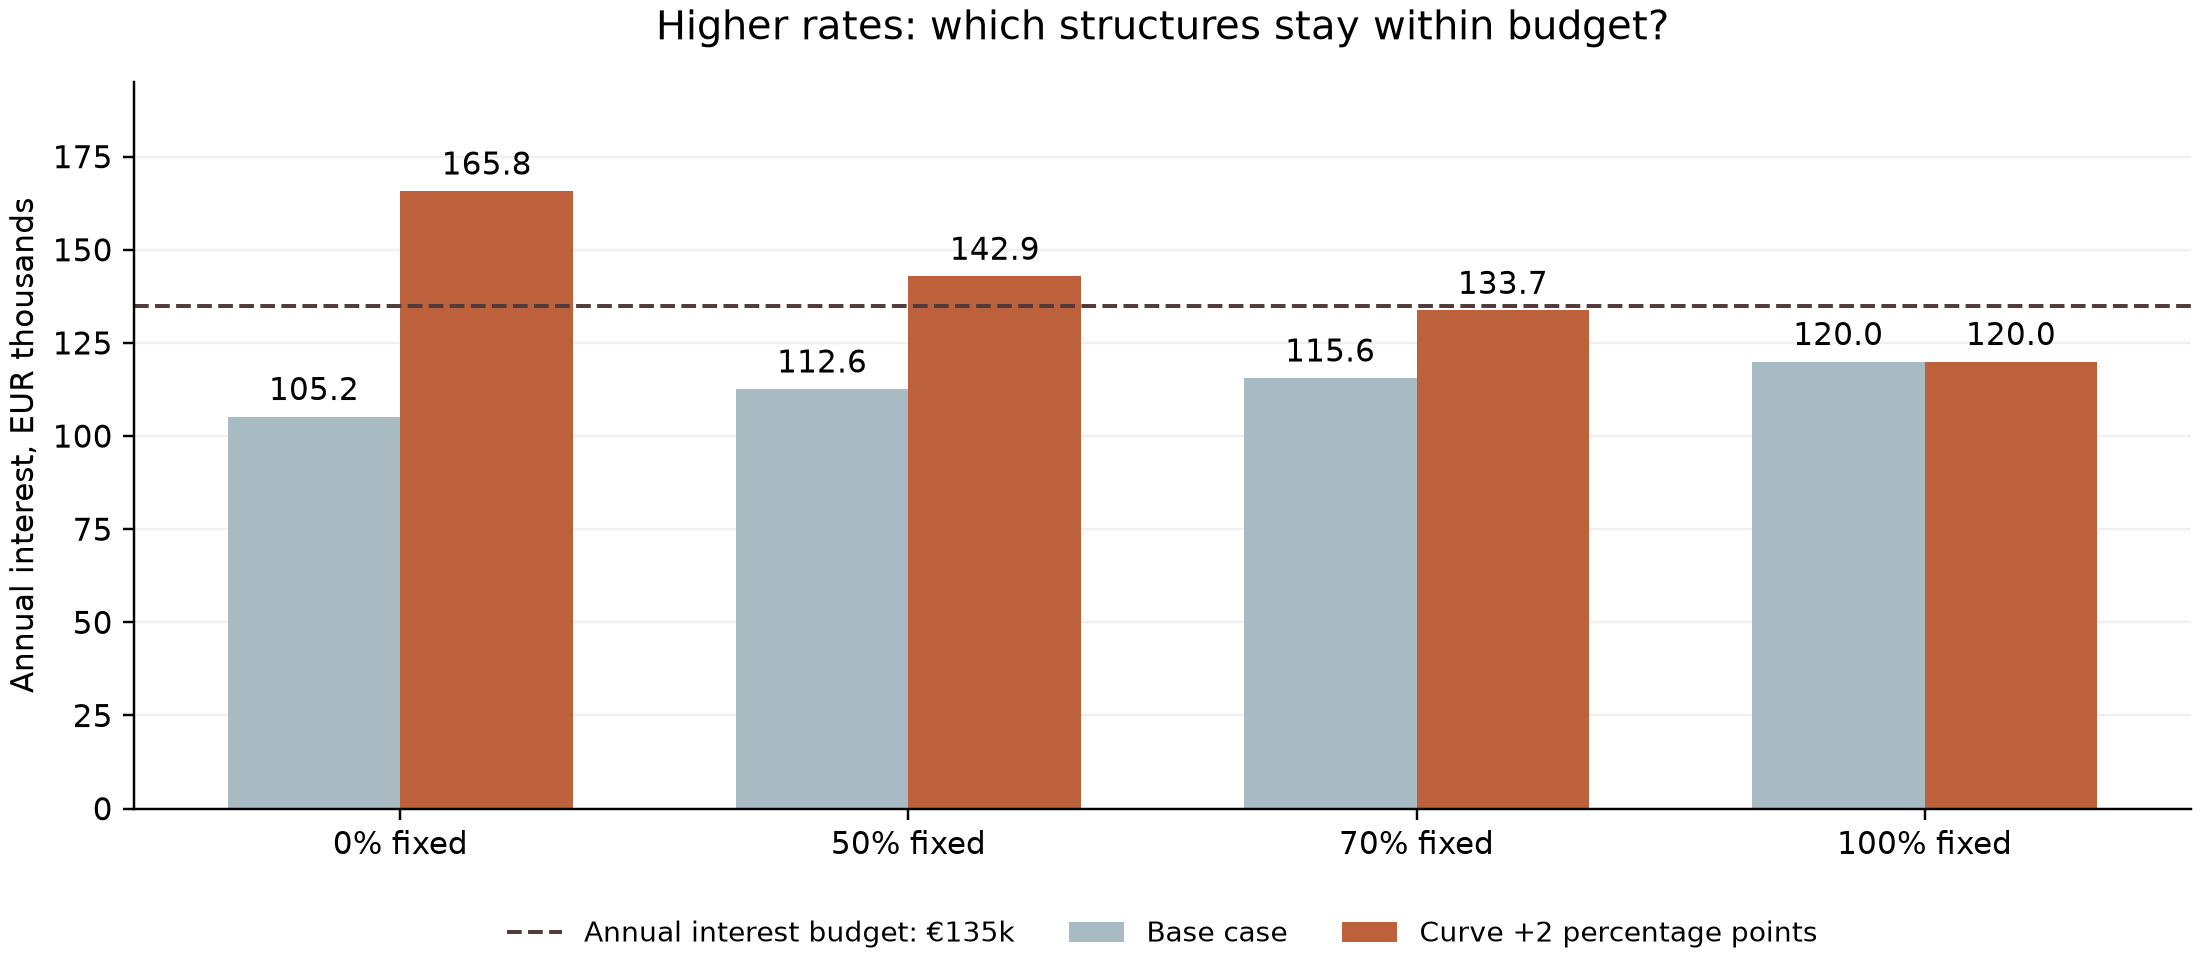
Entirely floating debt exceeds the budget by €30,762 a year. Fixing half the debt is still insufficient: the excess is €7,881. Of the four structures tested, 70/30 is the first with enough fixed-rate debt to remain within the limit.
But its headroom is just €1,271 a year. That is narrow protection against this particular shock, not a comfortable cushion against every outcome. Fully fixed debt leaves €15,000 of interest-budget headroom.
Over three years, conditional interest totals €497,287, €428,643, €401,186 and €360,000 respectively. The chart measures interest expense, not the company’s cash balance.
3. What if the curve falls by one percentage point?
Now reduce every zero-curve node from 2.50% to 1.50%. Keep the fixed coupon and margin unchanged. The floating rate falls to approximately 2.5028%. This tests the cost of protection when rates move in favour of floating-rate borrowers.
| Fixed / floating | Annual interest | Reduction from base | 36-month interest |
|---|---|---|---|
| 0% / 100% | €75,084 | €30,150 | €225,253 |
| 50% / 50% | €97,542 | €15,075 | €292,627 |
| 70% / 30% | €106,525 | €9,045 | €319,576 |
| 100% / 0% | €120,000 | €0 | €360,000 |
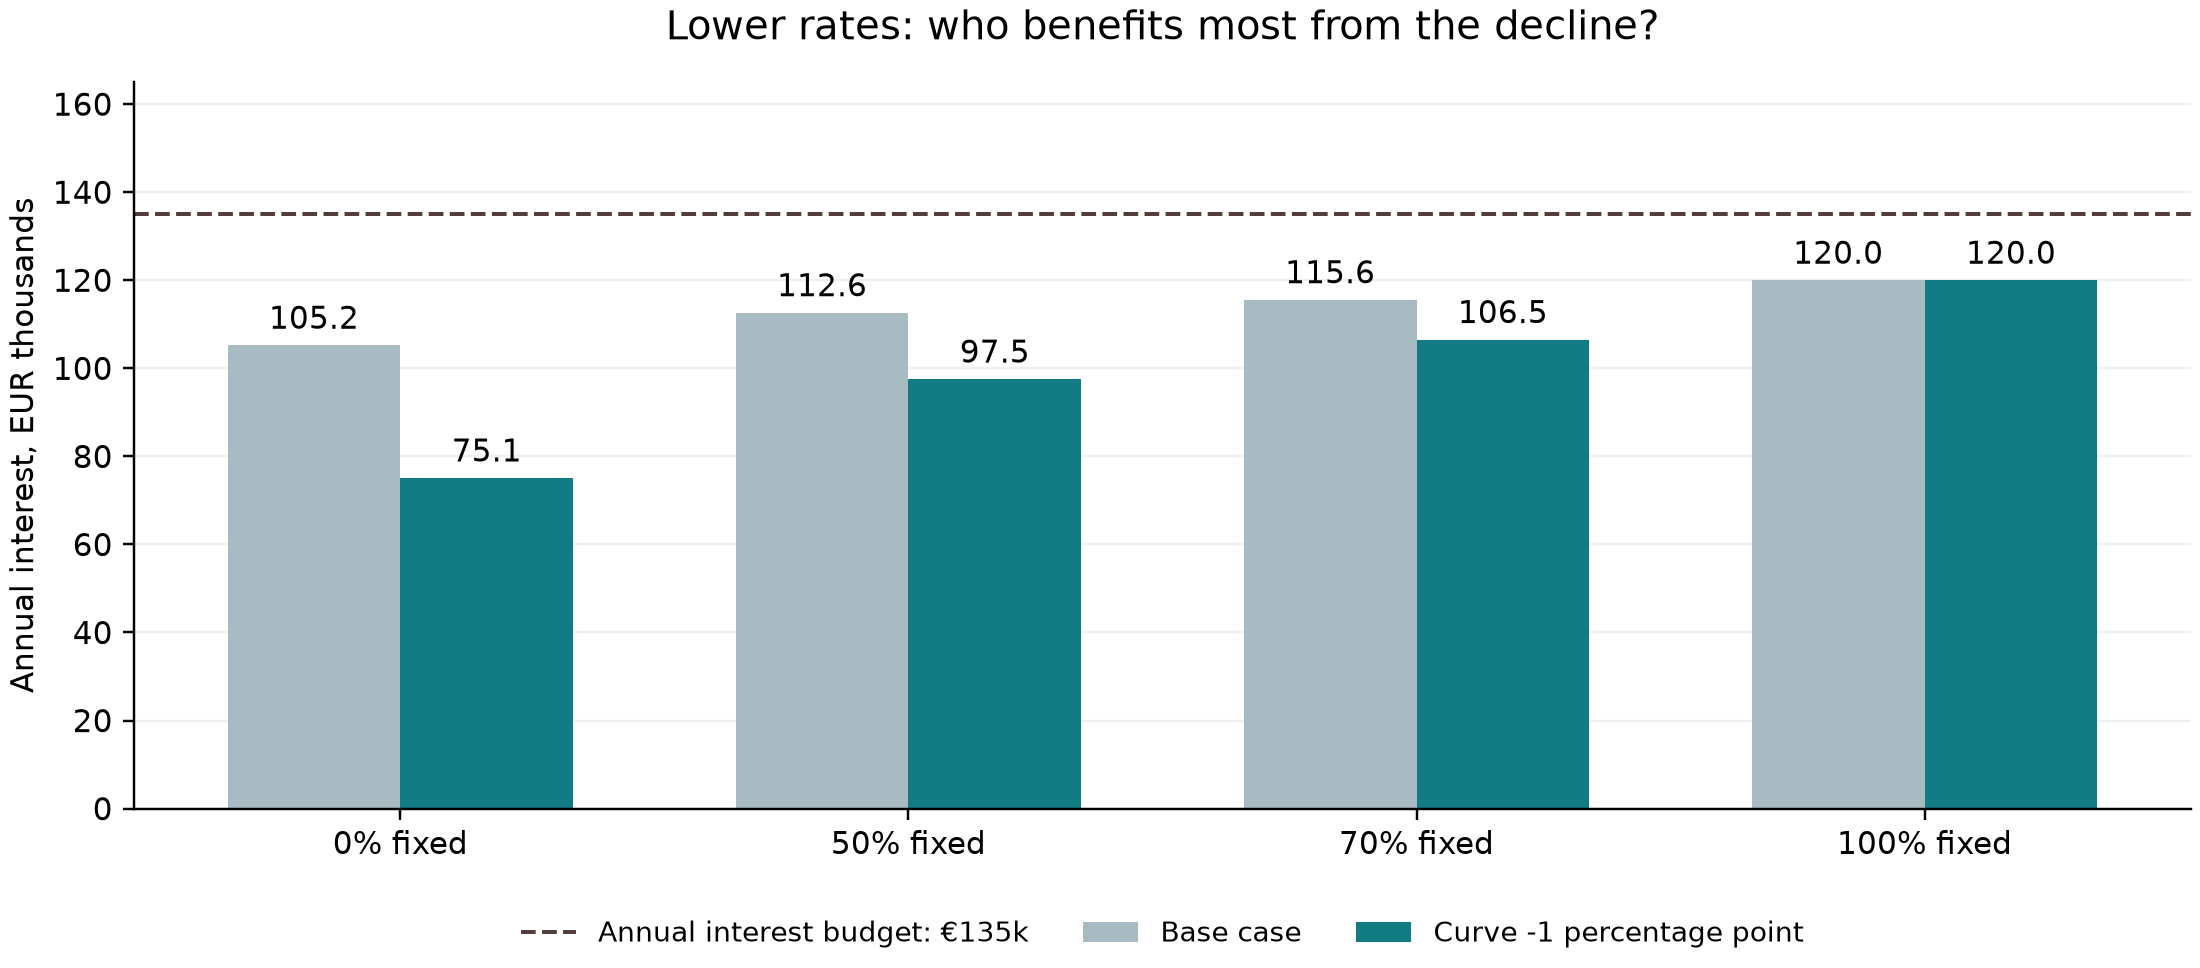
The entirely floating portfolio receives the largest reduction: about €30,150 a year. Under 70/30, the reduction is €9,045. The fixed portion does not become cheaper because its contracted coupon has not changed.
In this scenario, 70/30 costs €31,441 more a year than entirely floating debt. That is not a separate fee: it is the difference between the interest expenses of the two structures. Full fixing removes sensitivity to the curve but also removes the benefit of its decline.
The scenarios are not forecasts and have no assigned probabilities. We do not average them into an “expected saving”.
4. The decision: start with the budget, not a preferred rate
| Structure | Base annual interest | Higher-rate test | Trade-off |
|---|---|---|---|
| 0% fixed | €105,235 | Above limit | Lowest base cost; full rate sensitivity |
| 50% fixed | €112,617 | Above limit | Partial protection; insufficient for this test |
| 70% fixed | €115,570 | €1,271 below limit | Passes the test with limited headroom |
| 100% fixed | €120,000 | €15,000 below limit | Constant coupon; no benefit from falling rates |
If the sole objective is the lowest conditional interest cost in the base case, entirely floating debt wins. If the objective also includes the €135,000 annual limit under the two-percentage-point increase, both 70/30 and fully fixed debt pass.
A supplementary calculation gives a minimum fixed share of approximately 67.22% to meet the limit under that shock. This explains why 50% is insufficient and 70% is sufficient. The threshold is an analytical calculation for this article, not an automatic recommendation produced by DM.
There is no universally optimal 70/30 mix. A lower budget, a larger shock or a different contracted fixed coupon changes the conclusion. Even under these assumptions, a company seeking more headroom could prefer a higher fixed share.
What this case demonstrates about Debt Management
The practical value is to compare structures using the same principal, horizon and rate assumptions, then measure how conditional interest changes. That turns “which rate is lower?” into a more useful discussion: how much rate sensitivity can we accept, and what does limiting it cost?
This case uses DM’s valuation engine for predefined portfolios held unchanged until maturity. It does not use the automatic selection of refinancing timing or structure. The four-portfolio comparison and budget test are editorial analysis built on the engine’s calculations; they are not presented as a ready-made allocation screen or budget-optimisation feature.
A separate question remains: can operating cash flows cover interest and the final principal payment? This case does not model revenue, operating costs, taxes or available cash.
Explore the Corporate Debt Management Platform to see how debt inputs and financing decisions are analysed.
Method and calculation checks
Source and scope. The calculations use a local run of the CFSE V4 engine referenced by the DM integration, with synthetic inputs. This is not a saved LIVE customer report or a new production-session test. All 12 portfolio/scenario combinations pass the integration’s input eligibility check and agree with an independent valuation and a closed-form calculation to within €0.004.
Curve and accrual. The synthetic curve has nodes at 0.25, 0.5, 0.75, 1, 2, 5, 7 and 10 years. Every node has the same continuously compounded zero rate in each scenario. For a zero rate z, the annualised quarterly floating rate is 4 × (exp(z / 4) − 1), plus the 0.01 contractual margin. This is why the curve shock and the change in the final coupon are not numerically identical. The model-implied reference rate is not an observed Euribor fixing.
Budget threshold. The minimum fixed share is (5.5254% − 4.50%) / (5.5254% − 4.00%) ≈ 67.22%, using unrounded rates. Here 4.50% is the budget divided by principal: €135,000 / €3,000,000. Tables round to whole euros and charts to €0.1 thousand. Differences are calculated before display rounding.
Exclusions. Fees, early-repayment charges, taxes, execution constraints, terminal market values and liquidity are outside this comparison. Principal is due in month 36; no refinancing after that date is modelled. For background on zero, forward and par curves, see the ECB’s yield-curve methodology. The illustrative curves here are not ECB market data.
Corporate Debt Lab provides the platform discussed in this article. This illustrative case study was prepared with AI assistance.